
How to Read a Cereal Box Nutrition Facts Label
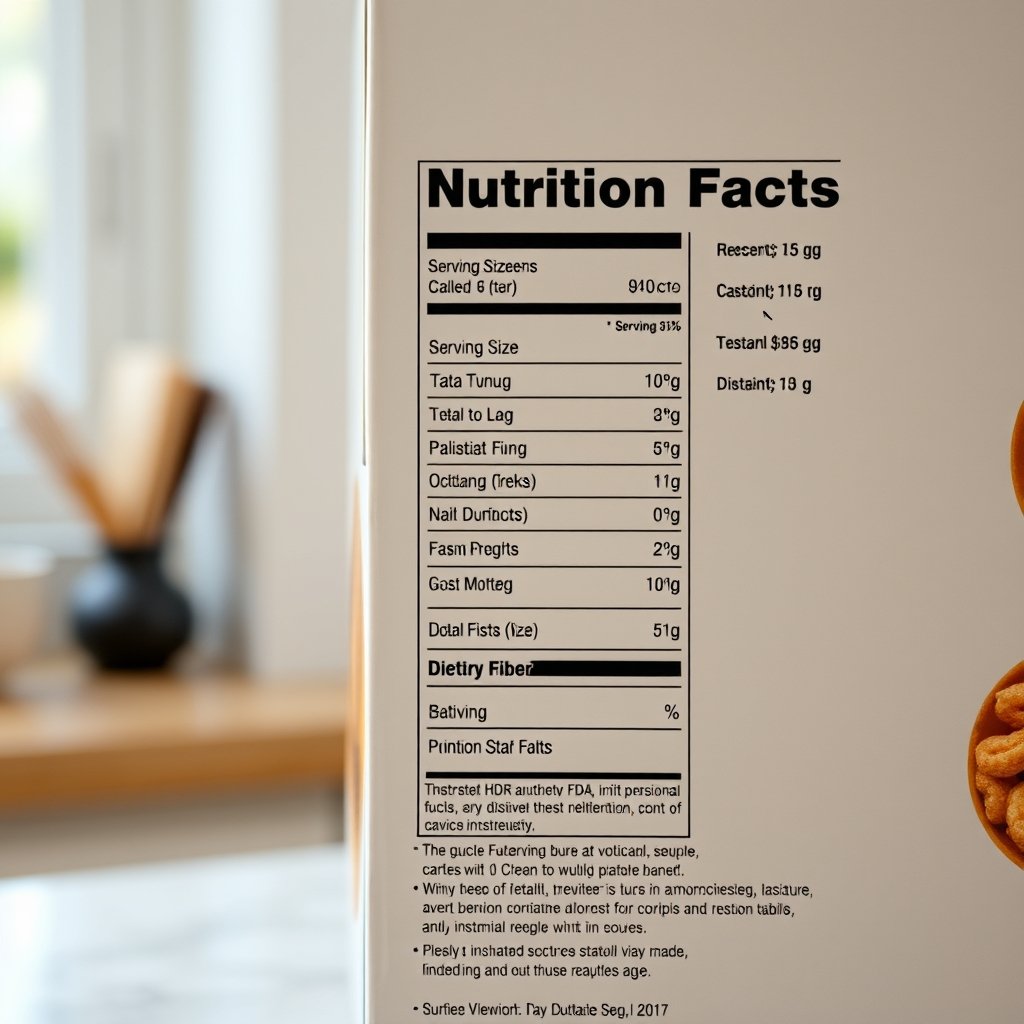
Every packaged breakfast food tells two different stories. The front panel features bold marketing claims, vibrant graphics, and enticing health promises. The side panel, however, provides an objective regulatory breakdown. The standardized cereal box nutrition facts label serves as an empirical ledger for consumers, translating industrial formulation into standardized dietary metrics overseen by the Food and Drug Administration (FDA).
Understanding how to evaluate this panel removes the guesswork from breakfast choices. Rather than relying on front-of-package slogans, learning to decode serving weights, fiber thresholds, micronutrient fortification, and refined sweeteners provides clear insight into what enters your bowl each morning.
Defining the Cereal Box Nutrition Facts Label: Core Concepts and Fundamentals
The panel on the side of a cereal carton is not arbitrary; it represents a legally mandated framework established under the Nutrition Labeling and Education Act and continually modernized by federal food regulators. Its primary objective is simple: provide transparent, uniform dietary data that allows consumers to make apples-to-apples comparisons across different brands and grain categories.
At its core, navigating the cereal box nutrition facts label requires understanding several mandatory sections:
- Serving Metrics: Includes both household measurements (such as cups or tablespoons) and mandatory metric weights listed in grams.
- Energy Density: Expressed as total calories per single standard serving.
- Core Macronutrients: Total fat, saturated fat, trans fat, cholesterol, sodium, total carbohydrates, dietary fiber, total sugars, added sugars, and protein.
- Required Micronutrients: Explicit milligram or microgram disclosures alongside percentage daily values for vitamin D, calcium, iron, and potassium.
- Footnote Benchmarks: A foundational statement explaining that percent Daily Values (%DV) are calculated using a baseline diet of 2,000 calories per day.
By anchoring these elements to specific weights, the label prevents manufacturers from obscuring caloric or sugar density through deceptive packaging designs.
How It Works: The Underlying Mechanics
Interpreting the nutrition panel requires recognizing that breakfast cereals present unique analytical challenges. Unlike whole produce or fresh poultry, cold cereals range dramatically in physical density, grain structure, and fortification levels.
The Dual-Column Mechanism
Many breakfast cereals utilize a dual-column format. The first column outlines the nutritional profile of the dry cereal alone. The adjacent column calculates those same values combined with one-half cup of skim or low-fat milk. This mechanism accounts for the fluid medium most people use to consume cereal, showing how dairy or fortified plant beverages alter protein, sodium, calcium, and total caloric load.
Daily Values and Mathematical Benchmarks
The Percent Daily Value (%DV) shows how much a nutrient in a single serving contributes to an individual's total daily dietary requirements. The mathematical baseline operates on a universal rule of thumb:
- 5% DV or less indicates a low concentration of that specific nutrient.
- 20% DV or more denotes a high concentration of that nutrient.
This percentage system is critical for identifying whether a product acts primarily as a source of beneficial elements—such as dietary fiber and iron—or delivers excessive amounts of nutrients consumers generally need to moderate, such as sodium and added sugars.
Volumetric Discrepancies versus Gram Weights
The physical mechanics of dry cereal can easily mislead consumer portion perceptions. A half-cup serving of heavy oat clusters often weighs 55 to 60 grams. Conversely, a full cup and a quarter of puffed rice or flaked corn might weigh only 30 to 40 grams. While the volumetric visual inside a bowl looks significantly larger for puffed grains, the actual mass and energy yield of the clustered grains can be more than double. Relying on metric gram weight rather than cup measurements is the only reliable way to understand true portion density.
Critical Drivers and Key Influencing Factors
Modern updates to food labeling standards have transformed how breakfast cereals communicate nutritional contents. Specific regulatory drivers shape what appears on the box today.
Reference Amounts Customarily Consumed (RACC)
Federal regulations governing the cereal box nutrition facts label mandate serving sizes based on Reference Amounts Customarily Consumed (RACC). Regulators divide breakfast cereals into distinct regulatory classes based on density:
- Light cereals (less than 20 grams per cup, such as puffed grains).
- Medium cereals (between 20 and 43 grams per cup, such as traditional flakes).
- Heavy cereals (43 grams or more per cup, including dense granolas and biscuit varieties).
Because RACC guidelines reflect what people actually eat in real-world scenarios rather than idealized dietary recommendations, manufacturers cannot arbitrarily shrink serving sizes to artificially depress reported sugar or calorie metrics.
The Added Sugars Mandate
Prior labeling formats grouped all carbohydrates categorized as mono- and disaccharides into a single "Sugars" line item. Current regulations require explicit separation between naturally occurring sugars (such as those inherent in dried fruit or dairy additions) and "Added Sugars." This distinct metric reveals cane sugar, high-fructose corn syrup, brown rice syrup, honey, and concentrated fruit juice purées incorporated during manufacturing.
Fortification Dynamics
Breakfast cereals have historically served as a primary distribution vehicle for population-level micronutrient fortification. As a result, label panels frequently highlight values reaching 50% to 100% of the Daily Value for iron, thiamin, riboflavin, niacin, and folic acid. These figures reflect synthetic vitamin-mineral premixes sprayed onto grain flakes or extruded shapes during secondary manufacturing steps.
Practical Industry Examples and Real-World Applications
To see how these principles function on real grocery shelves, consider how three common cereal profiles present their data.
Scenario 1: The Whole-Grain Flake
A traditional bran or wheat flake cereal lists a serving size of 1 cup (approximately 60 grams). The label indicates 210 calories, 1.5 grams of total fat, 220 milligrams of sodium, and 46 grams of total carbohydrates. Within those carbohydrates, dietary fiber registers at 8 grams (29% DV), while total sugars measure 8 grams, of which 5 grams are added sugars.
In this example, the high dietary fiber count effectively moderates carbohydrate uptake, meeting the threshold for a nutrient-dense choice despite moderate added sweeteners.
Scenario 2: The Extruded Sweetened Loop
A brightly colored children's grain ring lists a serving size of 1 cup (roughly 39 grams). The label reflects 150 calories, 1.5 grams of total fat, 210 milligrams of sodium, and 34 grams of total carbohydrates. The fiber content registers at less than 1 gram (3% DV), while total sugars reach 12 grams, all 12 of which are classified as added sugars.
Evaluating a cereal box nutrition facts label across breakfast cereals demonstrates that while total calories appear lower here than in the bran flakes, the nutrient density is sharply inverted. Sweetened loops offer minimal digestive fiber alongside nearly a full tablespoon of refined sweeteners per single cup.
Scenario 3: Dense Whole-Oat Clusters
A cluster-style cereal lists a serving size of 1/2 cup (55 grams). It reports 260 calories, 9 grams of total fat (driven by added seeds and plant oils), 140 milligrams of sodium, 39 grams of total carbohydrates, 4 grams of fiber, and 11 grams of added sugars.
Here, the volume is half that of flaked varieties, yet the caloric yield is substantially higher. A consumer filling a standard 2-cup bowl with these dense clusters would consume over 1,000 calories and 44 grams of added sugar without realizing they have quadrupled the listed serving size.
Debunking Common Misconceptions
Front-of-package marketing often creates cognitive biases that obscure the empirical reality on the side panel.
- Misconception: 'Made with Whole Grains' guarantees high fiber.
A product can legally claim it is made with whole grains if whole wheat or oats appear in the formulation, even if refined flours dominate the ingredient sequence. Always verify the Dietary Fiber line on the nutrition panel; look for at least 3 to 5 grams per serving. - Misconception: Organic or unrefined sweeteners change the label profile.
Labels do not differentiate between organic coconut nectar, agave, raw turbinado sugar, or industrial corn syrup. On the nutrition panel, all metabolized mono- and disaccharides appear equally under "Added Sugars." - Misconception: A single bowl equals a single serving.
Typical tableware bowls hold between 2 and 3 cups of dry volume. Pouring cereal until the bowl looks full often doubles or triples the numbers reported on the label panel.
Strategic Best Practices for Everyday Decision-Making
Adopting a consistent evaluation strategy simplifies grocery decisions and keeps meal planning aligned with personal wellness targets. When inspecting the carton, follow these four analytical steps:
- Check the gram weight first. Identify the metric weight of the serving size rather than relying solely on the cup measurement to understand physical density.
- Calculate the carbohydrate-to-fiber ratio. A reliable heuristic for identifying quality grain foods is maintaining at least 1 gram of dietary fiber for every 5 to 10 grams of total carbohydrates.
- Inspect the Added Sugars ceiling. Aim for cereals that keep added sugars under 6 grams per serving (representing roughly 12% DV or less of the recommended 50-gram daily ceiling for an average adult).
- Cross-reference the first three ingredients. Directly beneath the nutrition panel, review the ingredient statement. The first three items represent the primary bulk of the product by weight; look for whole grain flours rather than refined starches or syrups in those opening slots.
Mastering how to interpret the cereal box nutrition facts label empowers you to navigate supermarket aisles objectively, ensuring your morning meals provide genuine sustained energy rather than hidden sugar loads.
You Might Also Like

Semi Skimmed Milk Nutrition Facts: A Data-Driven Analysis
Explore the verified semi skimmed milk nutrition facts. Understand the macronutrient profile, calcium content, and how…
Read More →
Understanding a Level 4 Nutrition Course Online: A Comprehensive Guide
Explore the foundational principles, mechanics, and practical applications of enrolling in a level 4 nutrition course…
Read More →
Nutrition Information for Skim Milk: A Simple Beginner’s Guide
Learn the essentials of nutrition information for skim milk. This beginner's handbook breaks down key benefits,…
Read More →